Stocks continued their upward trajectory in early 2024. The S&P 500 returned more than 10% for a second consecutive quarter, setting multiple new all-time highs along the way. Notably, this quarter saw a significant shift in sentiment, as investors now only expect three interest rate cuts this year as compared to six at the start of the year. This change in expectations came as inflation progress slowed and the U.S. economy continued to expand despite higher interest rates, both of which signal a need for fewer rate cuts. This letter recaps the first quarter, discusses the stock market’s strong start to 2024, and looks ahead to the second quarter.
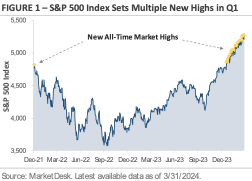
S&P 500 Sets 22 New All-Time Highs in Q1
The stock market is off to a strong start this year, with the S&P 500 Index gaining +10.4% in the first quarter. Figure 1 graphs the price of the S&P 500 Index since the end of 2021. The yellow dots mark new all-time closing highs. On the far-left side of the chart, the single yellow dot marks the previous all-time closing high set on January 3rd, 2022. Shortly after the January 2022 all-time high, the Federal Reserve started its campaign of aggressive interest rate hikes as inflation spiked to a 40-year high. The chart shows the 2022 stock market selloff as investors feared that higher interest rates would slow the economy.
The January 2022 all-time closing high held throughout all of 2022 and 2023, but it’s already been eclipsed multiple times in 2024. After trading below its prior all-time high for over two years, the S&P 500 Index has set 22 new all-time closing highs this year. The yellow dots on the far-right side of the chart mark these new highs and show the S&P 500’s steady climb higher in early 2024.
Inflation Progress Slowed in Q1
Inflation was on a steady downward trend heading into this year, and the market expected it to continue moving lower. However, recent data is causing investors to rethink that assumption. Figure 2 graphs the year-over-year change in the Consumer Price Index, which measures the change in price for a basket of consumer goods. The chart shows the inflation spike in 2021 and early 2022, followed by a period of easing inflation during the past two years. However, the yellow box shows that the pace of inflation progress has slowed recently. While inflation is still drifting lower, it’s not falling as quickly as investors or the Federal Reserve want.
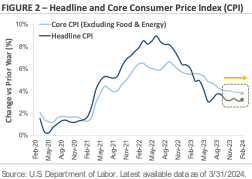
The question is whether the slowing progress is the start of a new trend or a temporary break in the current trend. Seasonality may be contributing to the slowdown, as inflation tends to be higher earlier in the year and then lower later in the year. Is the early 2024 rise the result of previously agreed upon contractual price increases, or does it hint at something more under the surface? Federal Reserve Chair Jerome Powell believes the early 2024 inflation bump is seasonal and short-term in nature. The market is less certain and more divided.
The chart also demonstrates that getting back to the Fed’s 2% inflation target will be bumpy and uneven. The disinflation process won’t be a straight line. The latest risk is rising oil prices, with the price of a regular gallon of gasoline jumping by over +20% during Q1. Falling energy prices helped to ease inflation pressures during the past two years, but there is now a question about whether that trend can continue with gas prices rising.
Investors Expect Fewer Interest Rate Cuts This Year
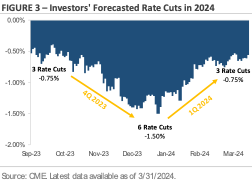
One of the big debates heading into 2024 was how many times the Federal Reserve would cut interest rates. Figure 3 tracks the market’s rate cut forecast. Looking back to the start of Q4 2023, the market expected the Federal Reserve to cut interest rates by -0.75% this year. By the end of December, the market’s rate cut forecast for the entirety of 2024 had risen to -1.50%. Based on a typical rate cut increment of -0.25%, investors came into this year expecting six interest rate cuts (i.e., -1.50% in total cuts). In contrast, the Federal Reserve only expected three interest rate cuts at the start of this year, or half the market’s estimate. There was a debate over whose interest rate cut forecast was more accurate. As of the end of Q1, the central bank’s forecast appears more accurate. Investors now only expect three interest rate cuts this year, which is in line with the Fed’s initial forecast.
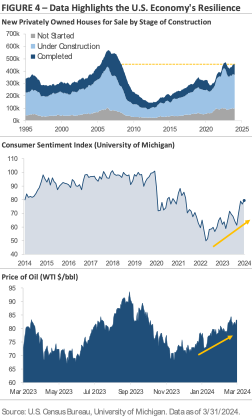
Why do investors expect fewer interest rate cuts this year? One reason is that inflation progress is slowing. Another reason is that the U.S. economy remains resilient despite higher rates. Figure 4 graphs three data points that underscore this resilience. The top chart graphs the number of new homes for sale by stage of construction: not started; under construction; and completed. The chart shows home construction activity is at levels not seen since before the 2008 financial crisis, despite the average 30-year fixed-rate mortgage sitting near a 15-year high of 7%. The middle section shows consumer sentiment rose to a 2.5-year high in March after setting a record low in June 2022. Multiple factors are contributing to the improved sentiment, including a tight labor market, rising stock prices and home values, expectations for a continued decline in inflation, and a solid economic backdrop. The bottom chart tracks the price of a barrel of West Text Intermediate crude. Crude oil prices have risen from approximately $70 per barrel at the start of the year to $83 per barrel at the end of Q1, an increase of roughly +18.5%. Oil is a cyclical commodity, so rising oil prices suggest demand is strong and may hint at underlying strength in the U.S. economy.
Equity Market Recap – Stocks Post a Second Consecutive Quarter of Strong Gains
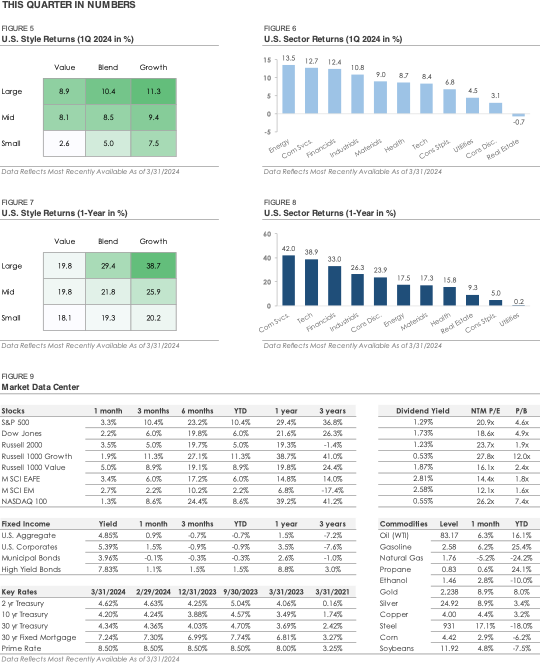
The opening section discussed the stock market’s strong start to the year. Following an impressive +11.6% gain in Q4, the S&P 500 returned +10.4% in Q1. Small cap stocks underperformed during the quarter, as the Russell 2000 Index returned +5.0%. Ten of the eleven S&P 500 sectors posted gains, with cyclical sectors outperforming their defensive counterparts. The energy, financial, and industrial sectors each outperformed the broader S&P 500 Index, while the real estate, utility, and consumer staple sectors underperformed as the stock market rallied.
International stocks underperformed U.S. stocks for a fourth consecutive quarter during Q1. Over the past twelve months, the MSCI EAFE Index of developed market stocks has returned +14.8%, or roughly half of the S&P 500’s +29.4% return. The MSCI Emerging Market Index has returned only +6.8%, or approximately one-fourth of the S&P 500. A few themes may explain why international stocks continue to underperform. First, international stock market indices lack exposure to leading artificial intelligence companies like Microsoft, Nvidia, and Super Micro Computer. Second, as discussed above, the U.S. economy continues to expand despite higher rates. In contrast, some countries and regions outside the U.S. are already feeling the impact of higher interest rates. Investors have been attracted to the U.S. for both its AI exposure and relative economic strength.
Credit Market Recap – Bonds Trade Lower After a Strong Fourth Quarter
While stocks started the year off with strong gains, bonds traded lower during Q1. The losses came as investors realized that the continued resilience of the U.S. economy meant the Federal Reserve may not need to cut interest rates as much, which caused Treasury yields to rise. The Bloomberg U.S. Bond Aggregate Index, which tracks a broad index of investment-grade rated bonds, posted a total return of -0.7%. It was a sharp reversal from Q4, when the index posted its first quarterly gain since Q1 2023 and its biggest quarterly gain since 1989.
In the corporate bond category, investment-grade bonds underperformed high-yield bonds during Q1. Over the past twelve months, high-yield corporate bonds have generated a total return of +8.8%, which factors in the interest payments received. Investment-grade corporate bonds generated a +3.5% total return over the same period. The high-yield bond universe continues to benefit from multiple themes. First, the group yields 7.83% at the end of Q1, which is 2.45% higher than investment-grade bonds. This extra yield helps boost high-yield’s total return. Second, as Figure 4 highlights, the U.S. economy has remained resilient despite higher interest rates. With the U.S. economy expanding at a solid pace, high-yield bonds’ credit risk has remained stable, limiting the number of defaults.
Second Quarter Outlook – Themes to Watch
The big investment themes were mostly unchanged during the first quarter. Stocks continued to trade higher, and the U.S. economy remained in expansion mode. While the market now expects fewer interest rate cuts this year, the primary reason is that investors and the Fed believe the U.S. economy can handle higher interest rates. Economic theory suggests that higher interest rates should slow economic activity as the cost of capital increases, but the data tells a different story this cycle. Home construction activity is the strongest since before 2008, consumer sentiment recently hit a 2.5-year high, and unemployment remains below 4%.
It’s difficult to overstate the uniqueness of this economic cycle. There was unprecedented monetary and fiscal stimulus in 2020 and 2021, followed by a rapid rise in interest rates in 2022 and 2023 as inflation reached levels not seen since the 1970s. In the housing market, many homeowners locked in low mortgage rates during the past few years, which has effectively limited the impact of rising interest rates. The labor market remains relatively tight after five million workers left the labor force during the pandemic and didn’t return, which has not been seen before. These themes won’t reverse quickly and will have long-lasting impacts, which both the Federal Reserve and markets must navigate. We will continue to monitor financial markets and the economy, provide timely updates to you, and adjust portfolios as needed.
Blakely Financial, Inc. is an independent financial planning and investment management firm that provides clarity, insight, and guidance to help our clients attain their financial goals. Engage with the entire Blakely Financial team at WWW.BLAKELYFINANCIAL.COM to see what other financial tips we can provide towards your financial well-being.
Commonwealth Financial Network® or Blakely Financial does not provide legal or tax advice. You should consult a legal or tax professional regarding your individual situation
All indices are unmanaged, and investors cannot actually invest directly into an index. Unlike investments, indices do not incur management fees, charges, or expenses. Past performance does not guarantee future results.