fbpx window.dataLayer = window.dataLayer || []; function gtag(){dataLayer.push(arguments);} gtag('js', new Date()); gtag('config', 'UA-156569540-1');
Decoding the Debt Ceiling Crisis: An Update

Decoding the Debt Ceiling Crisis: An Update

Presented by Steve LaFrance, CFP®

We’ve discussed the debt ceiling crisis in past articles, and now it’s back in the headlines. What does this mean, and why are we watching it now? Several months ago, the U.S. borrowed as much money as it’s legally allowed to borrow and, since then, has been prohibited from borrowing more. In the language of the headlines, we have hit the debt ceiling.

If that sounds like an awkward situation, it is. It also raises very real economic and market risks, which are being played out in the news. Let’s analyze in detail what this all means.

The Current Situation

The U.S. government runs a deficit, meaning it spends more than it brings in. So, it continually borrows more to pay the outstanding bills. The problem is that Congress has put a limit on the total amount the government can borrow, also known as the debt ceiling. Congress needs to raise that limit on a regular basis to account for approved deficit spending. Raising the debt limit has become a regular political football, which is why we’re having this conversation again. Congress has not raised the limit, and we have reached the debt ceiling again.

Once the debt limit is hit, the Treasury cannot issue any more debt but must keep paying the bills. There are “extraordinary measures,” tested in previous debt-limit confrontations, which would allow this to be done in the short term. These include shifting money among different government accounts to fill the gap until more borrowing is allowed. Two examples of this are affording the debt by suspending retirement contributions for government workers or repurposing other accounts normally used for things such as stabilizing the currency. The idea is that this will buy time for Congress to authorize more borrowing. This is where we are now, and where we have been for the past several months.

The Consequences If Congress Doesn’t Act

At a certain point—tentatively estimated to be around June or July, but this is very uncertain—the Treasury will run out of money to pay the bills. Among those bills are salaries for federal workers. So, at some point, the government will largely shut down. Some bills will get paid, but many government obligations will go unpaid.

Why We Should Care

Setting aside the political aspect of the situation, this affects investors for several reasons. First, cutting off government payments will hurt economic growth. Limits on social security payments, for example, would severely hurt economic demand and confidence. Although social security would likely be the last thing cut, other cuts would also hurt growth and confidence. We saw this in prior shutdowns, and the damage was real.

The bigger problem, however, is if payments to holders of U.S. debt are not made and the Treasury market goes into default. U.S. government debt has always been the ultimate low-risk asset, where default was assumed to be nearly impossible. Adding a default risk would raise interest rates, potentially costing the country billions over time. The economic risk, both immediate and long term, is very high—and that’s what the headlines are emphasizing.

Possible Solutions

We have been down this road before, and while the ending could be bad, we’ve resolved the problem every previous time. There are a few ways we could do this without systemic damage.

The easiest and most likely course of action is for Congress to cut a deal. At this point, it seems the group of Congresspeople really looking for an extended confrontation is quite small. If that’s true, a deal is very possible, and even likely, as pressure mounts.

On the other hand, if Congress cannot or will not come to an agreement, there are other ways the government can resolve the problem before it blows up. These range from the reasonably credible, such as using a line from the Fourteenth Amendment of the U.S. Constitution to justify ignoring the limit entirely, to the reasonable but iffy, such as issuing lower face value bonds with higher coupons. There are also borderline crazy solutions, such as issuing a $1 trillion coin. In short, there are many options other than default. As we saw in the financial crisis, the government is willing to do many things that were previously unimaginable to avoid a crisis, and I am quite certain that will be the case here as well.

What Happens If We Default

Defaulting is not the end of the world, and here’s why. First, a default happened in 1971 for technical reasons. Since the reasons weren’t economic, investors looked through the default and the long-term consequences were minimal. Second, a default this time around also would not be economic; it would be political. When countries default because they can’t pay, that is a systemic problem—the lenders won’t be getting their money. In this case, though, we can and will pay. It will just take some time to get through the political process. If you think about it in personal terms, a late mortgage payment is quite different from foreclosure. No one is talking about repudiating or actually defaulting on U.S. debt over time, and the markets are reflecting that. Real default won’t happen, even if temporary default does

The Takeaway Message for Investors

Don’t panic. This has happened before and will likely happen again. The headlines are making the most of potential consequences, and the worst case would indeed be bad. But there are enormous incentives to cut a deal before we reach the worst-case scenario. And even if a deal is not cut, there are other non-default options. If we do get to default, the likely market volatility will drive a deal at that time. Failure to solve this problem really isn’t an option.

This is a big deal, and worth watching, but not worth worrying about yet. We’ll be keeping an eye on it and writing about any developments. In the meantime, keep calm and carry on.

Certain sections of this commentary contain forward-looking statements that are based on our reasonable expectations, estimates, projections, and assumptions. Forward-looking statements are not guarantees of future performance and involve certain risks and uncertainties, which are difficult to predict. Past performance is not indicative of future results.


###

Blakely Financial, Inc. is located at 1022 Hutton Lane Suite 109 High Point, NC 27262 and can be reached at 336-885-2530.
Securities and Advisory Services offered through Commonwealth Financial Network®, Member FINRA/SIPC, a Registered Investment Adviser. Fixed insurance products and services are separate from and not offered through Commonwealth Financial Network®.
Authored by Brad McMillan, CFA®, CAIA, MAI, managing principal, chief investment officer, at Commonwealth Financial Network®.
© 2023 Commonwealth Financial Network®
Blakely Financial Blog Images (6)

What Does the Silicon Valley Bank Collapse Mean for Investors?

Americans have suddenly witnessed three very large bank failures in only a few days’ time. The first was the collapse last week of Silvergate, also known as “the Crypto bank.” Soon after, we read the news of both Silicon Valley Bank (SVB) and Signature Bank collapsing. These are some of the largest bank failures in U.S. history. What is going on here? Should we be worried? Is another financial crisis on the horizon? The short answer is no.

Why We Shouldn’t Press the Panic Button

Let’s start with the bottom line before we get into the details. This is something to keep an eye on, but it’s not the start of the next financial crisis. Unlike in the great financial crisis of 2008, the government is getting ahead of the problem rather than trying to clean up afterward. That is a very positive sign. We can certainly expect market turbulence—in fact, we’re seeing it already—but the systemic effects will be limited, and we’re not set for another major crisis.

Instead, the takeaway so far is that regulators and the federal government are on the case and are willing and able to support the financial system. Sunday night, the U.S. Treasury announced that depositors would be fully protected in the interest of maintaining systemic confidence and that funds were being made available to support banks under stress. Again, this quick action is what differentiates this situation from that of 2008.

What Will Happen Now?

Many people have written good descriptions of how and why these banks collapsed, and I won’t try to replicate those. To investors, the “why” is interesting, but what we really need to know is what it all means for the future.

The Federal Reserve’s (Fed’s) interest rate hikes are indeed affecting the financial system. The fact that the collapses have principally been in the tech and crypto spaces suggests that these sectors are even more at risk than the economy as a whole. While other banks will likely move to replace SVB, they will not be as focused or as dedicated to the sector, and things will slow down in the tech sector going forward. In short, one of the primary enablers of the tech boom is now gone.

Do These Failures Indicate a System-Wide Problem?

The answer to this question is good news. To set the stage, let’s look at the three factors that caused the financial system to lock up in 2008:

  • There was little transparency around asset values, which caused a lack of liquidity for those assets.
  • Banks didn’t have sufficient capital to weather a crisis.
  • There wasn’t enough available credit in the early stages of the crisis to support the banks until liquidity came back.

We’re in a very different place now on all three.

In terms of the liquidity issue, U.S. banks generally now hold very liquid assets, dominated by U.S. Treasury notes. Those values are clear, and there is a large market for them. Banks can raise cash, if necessary, simply by selling or borrowing against those assets.

Regarding sufficient capital, U.S. banks are, by and large, very well capitalized. They have the money to weather storms and, as noted, they can access those funds. These circumstances are both very different from those of 2008.

The third cause, lack of available credit, is where we must be careful. Banks have seen those Treasury notes decline in value significantly as rates rose, and there are questions in some cases about whether the value of the bank capital still covers the liabilities. This is what drove the collapse of SVB. What the Treasury did Sunday, however, was to solve this problem by providing a way for banks to borrow against long-term assets, like Treasuries, based on the par value, not the current market value. That largely eliminates the insolvency problem and will provide the credit that was missing in 2008. It will not eliminate the entire problem, though, as banks may still need to rebuild their capital bases. But it will allow the banks time to recover, which will be key to rebalancing the system.

Explained differently, the system is more transparent and has a more solid foundation compared to 2008. The government has also identified the remaining problems and put programs in place to deal with them. From a depositor’s perspective, the government’s decision to stand behind all deposits also reduces the risk of further bank runs. With a stronger system in place, and the government being aggressively proactive, there looks to be little systemic risk right now. We won’t see another great financial crisis.

What Comes Next?

What we can expect to see is continued turbulence. The primary purpose of diversification is to mitigate risk. By spreading your investment across different asset classes, industries, or maturities, you are less likely to experience market shocks that impact every single one of your investments the same. Our approach is to maintain a disciplined commitment to well-diversified portfolios. It may be a bumpy ride, but one that will eventually end. This story is not over yet, and we don’t fully know how it will play out. We do know, however, that we will make it through.

Certain sections of this commentary contain forward-looking statements that are based on our reasonable expectations, estimates, projections, and assumptions. Forward-looking statements are not guarantees of future performance and involve certain risks and uncertainties, which are difficult to predict. Past performance is not indicative of future results. All indices are unmanaged and investors cannot invest directly into an index.
Steve LaFrance, CFP®, AIF®, ChSNC®, MBA | Blakely Financial
Blakely Financial, Inc. is an independent financial planning and investment management firm that provides clarity, insight, and guidance to help our clients attain their financial goals. Engage with the entire Blakely Financial team at WWW.BLAKELYFINANCIAL.COM to see what other financial tips we can provide towards your financial well-being.
Commonwealth Financial Network® or Blakely Financial does not provide legal or tax advice. You should consult a legal or tax professional regarding your individual situation.
Securities and advisory services offered through Commonwealth Financial Network®, Member FINRA/SIPC, a Registered Investment Adviser.
401k Contributions Blakely Financial

401K Contributions: What you need to know

The IRS recently announced an increase in the maximum amount you can contribute to your employer-sponsored retirement plan in 2023. 

Due to high inflation, the cost-of-living adjustment means maximum retirement contributions will be rising almost 10% in the upcoming year. The contribution limit for employees who participate in 401(k), 403(b), most 457 plans, and the federal government’s Thrift Savings Plan has been increased to $22,500 ( which is up from $20,500 in 2022). Annual contribution limits have also been increased for traditional and Roth IRAs, up to $6,500 from the $6,000 limit of 2022.


What Does This Mean For Me?

If you are already making the maximum contribution to your 401(k) each year, this is good news for you, as you will be able to set aside even more money for retirement. If you are looking to maximize your retirement fund, you may want to consider contributing to both your employer-sponsored retirement plan and an IRA. 


If you cannot contribute the maximum amount to your retirement plan in 2023, don’t be concerned. Though the number has grown in recent years, only about 10-12% of people maximize their 401(k) contributions each year. Simply participating in an employer-sponsored plan puts you in a great position for a successful retirement, especially if you start early and remain consistent with your contributions. Remember that this increase is due to the high cost of living, so you may not have the funds left over to make your ideal contribution in 2023.  

Making the Most of your 401(k)

One of the most important financial planning strategies in saving for retirement is to maximize your employer’s 401(k) match. Taking advantage of that extra money can be a huge help to your retirement fund, especially if you are consistently contributing enough money to get the maximum match. If you are unsure about the specifics of your company’s plan, take the time to read over it thoroughly, perhaps with your financial advisor, so you can make the most of your money. 

A few key points to remember about a 401(k): it is a retirement savings plan, so once you put money in, it is always best to leave it in. There are penalties if you take the money out before retirement age. Also keep in mind that if you change employers, you can roll your vested balance into your new employer’s 401(k) plan or into another qualifying retirement account such as an IRA.

If you have questions, it is always a great idea to call your financial advisor for guidance. But no matter what, please take advantage of any type of savings plan your current employer offers as the earlier and more aggressive you are, the closer you will come to achieving your financial goals.

Engage with the entire Blakely Financial team at WWW.BLAKELYFINANCIAL.COM  to see what other financial tips we can provide towards your financial well-being.

Blakely Financial, Inc. is an independent financial planning and investment management firm that provides clarity, insight, and guidance to help our clients attain their financial goals.

Securities and advisory services offered through Commonwealth Financial Network, Member FINRA/SIPC, a Registered Investment Adviser.

Blakely Financial Inflation Update June 2022

High Inflation: How Long Will It Last?

In March 2022, the Consumer Price Index for All Urban Consumers (CPI-U), the most common measure of inflation, rose at an annual rate of 8.5%, the highest level since December 1981.1 It’s not surprising that a Gallup poll at the end of March found that one out of six Americans considers inflation to be the most important problem facing the United States.2

When inflation began rising in the spring of 2021, many economists, including policymakers at the Federal Reserve, believed the increase would be transitory and subside over a period of months. One year later, inflation has proven to be more stubborn than expected. It may be helpful to look at some of the forces behind rising prices, the Fed’s plan to combat them, and early signs that inflation may be easing.


Hot Economy Meets Russia and China

The fundamental cause of rising inflation continues to be the growing pains of a rapidly opening economy — a combination of pent-up consumer demand, supply-chain slowdowns, and not enough workers to fill open jobs. Loose Federal Reserve monetary policies and billions of dollars in government stimulus helped prevent a deeper recession but added fuel to the fire when the economy reopened.

More recently, the Russian invasion of Ukraine has placed upward pressure on already high global fuel and food prices.3 At the same time, a COVID resurgence in China led to strict lockdowns that have closed factories and tightened already struggling supply chains for Chinese goods. The volume of cargo handled by the port of Shanghai, the world’s busiest port, dropped by an estimated 40% in early April.4


Behind the Headlines

Although the 8.5% year-over-year “headline” inflation in March is a daunting number to consider, monthly numbers provide a clearer picture of the current trend. The month-over-month increase of 1.2% was extremely high, but more than half of it was due to gasoline prices, which rose 18.3% in March alone.5 Despite the Russia-Ukraine conflict and increased seasonal demand, U.S. gas prices dropped in April, but the trend was moving upward by the end of the month.6 The federal government’s decision to release one million barrels of oil per day from the Strategic Petroleum Reserve for the next six months and allow summer sales of higher-ethanol gasoline may help moderate prices.7

Core inflation, which strips out volatile food and energy prices, rose 6.5% year-over-year in March, the highest rate since 1982. However, the month-over-month increase from February to March was just 0.3%, the slowest pace in six months. Another positive sign was the price of used cars and trucks, which rose more than 35% over the last 12 months (a prime driver of general inflation) but dropped 3.8% in March.8

Slower at the Core Inflation Graphic

Wages and Consumer Demand

For the 12 months ended in March, average hourly earnings increased 5.6% — not enough to keep up with inflation but enough to blunt some of the effects. Lower-paid service workers received higher increases, with wages jumping by almost 15% for nonmanagement employees in the leisure and hospitality industry. Although inflation has cut deeply into wage gains over the last year, wages have increased at about the same rate as inflation over the two-year period of the pandemic.9

One of the big questions going forward is whether rising wages will enable consumers to continue to pay higher prices, which can lead to an inflationary spiral of ever-increasing wages and prices. Recent signals are mixed. The official measure of consumer spending increased 1.1% in March, but an early April poll found that two out of three Americans had cut back on spending due to inflation.10-11


Soft or Hard Landing?

The Federal Open Market Committee (FOMC) of the Federal Reserve has laid out a plan to fight inflation by raising interest rates and tightening the money supply. After dropping the benchmark federal funds rate to near zero in order to stimulate the economy at the onset of the pandemic, the FOMC raised the rate by 0.25% at its March 2022 meeting and projected the equivalent of six more quarter-percent increases by the end of the year and three or four more in 2024.12 This would bring the rate to around 2.75%, just above what the FOMC considers a “neutral rate” that will neither stimulate nor restrain the economy.13

These moves were projected to bring the Fed’s preferred measure of inflation, the Personal Consumption Expenditures (PCE) Price Index, down to 4.3% by the end of 2022, 2.7% by the end of 2023, and 2.3% by the end of 2024.14 PCE inflation — which was 6.6% in March — tends to run below CPI, so even if the Fed achieves these goals, CPI inflation will likely remain somewhat higher.15

Fed policymakers have signaled a willingness to be more aggressive, if necessary, and the FOMC raised the funds rate by 0.5% at its May meeting, as opposed to the more common 0.25% increase. This was the first half-percent increase since May 2000, and there may be more to come. The FOMC also began reducing the Fed’s bond holdings to tighten the money supply. New projections to be released in June will provide an updated picture of the Fed’s intentions for the federal funds rate.16

The question facing the FOMC is how fast it can raise interest rates and tighten the money supply while maintaining optimal employment and economic growth. The ideal is a “soft landing,” similar to what occurred in the 1990s, when inflation was tamed without damaging the economy. At the other extreme is the “hard landing” of the early 1980s, when the Fed raised the funds rate to almost 20% in order to control runaway double-digit inflation, throwing the economy into a recession.18

Fed Chair Jerome Powell acknowledges that a soft landing will be difficult to achieve, but he believes the strong job market may help the economy withstand aggressive monetary policies. Supply chains are expected to improve over time, and workers who have not yet returned to the labor force might fill open jobs without increasing wage and price pressures.19

The next few months will be a key period to reveal the future direction of inflation and monetary policy. The hope is that March represented the peak and inflation will begin to trend downward. But even if that proves to be true, it could be a painfully slow descent.

Projections are based on current conditions, are subject to change, and may not come to pass.


1, 5, 8-9) U.S. Bureau of Labor Statistics, 2022
2) Gallup, March 29, 2022
3, 7) The New York Times, April 12, 2022
4) CNBC, April 7, 2022
6) AAA, April 25 & 29, 2022
10, 15) U.S. Bureau of Economic Analysis, 2022
11) CBS News, April 11, 2022
12, 14, 16) Federal Reserve, 2022
13, 17) The Wall Street Journal, April 18, 2022
18) The New York Times, March 21, 2022

##

This material has been provided for general informational purposes only and does not constitute either tax or legal advice. Although we go to great lengths to ensure our information is accurate and useful, we recommend you consult a tax preparer, professional tax advisor, or lawyer.

Engage with the entire Blakely Financial team at WWW.BLAKELYFINANCIAL.COM to see what other financial tips we can provide towards your financial well-being.

Blakely Financial, Inc. is an independent financial planning and investment management firm that provides clarity, insight, and guidance to help our clients attain their financial goals.

Securities and advisory services offered through Commonwealth Financial Network, Member FINRA/SIPC, a Registered Investment Adviser

What’s Driving Gas Prices Higher?

What’s Driving Gas Prices Higher?

Whether you’ve seen the prices at the pump, clicked on the headlines, or overheard discussions in the grocery store, you know the rising cost of gas has everyone talking. At the start of the summer driving season, the average price of regular gasoline in the U.S. reached an all-time high, surpassing $4.50 per gallon. Inflationary pressures, including strong demand, supply chain disruptions, and low inventories, have caused price spikes for many consumer goods. As the cost of filling your tank rises, you’re likely wondering which markets factors caused the spike in gasoline prices.

Costs and Taxes

Crude oil is the most important input cost for gasoline. This commodity is primarily refined into gasoline and other transportation fuels, including diesel and jet fuel. Ethanol, a fuel made from corn, is blended with crude oil to represent 10 percent of gasoline volume on average, according to the Energy Information Administration (EIA). Operating costs associated with refineries, transportation (e.g., pipelines, tankers, trucking), and gas stations, as well as federal, state, and local government taxes, contribute to gasoline prices. Differences in operating costs and taxes explain the wide range of gasoline prices across states.

Higher Gasoline and Crude Oil Prices

Figure 1 illustrates the strong correlation between the prices for gasoline and crude oil, which is currently around $115 per barrel for West Texas Intermediate (WTI), the U.S. index. Prices for both commodities have just about doubled since early 2021. Covid-19 lockdowns in China and plans by several countries to release strategic oil reserves helped ease oil prices in recent months. The price of gasoline, however, has continued to increase.


Figure 1. U.S. Gasoline and WTI Crude Oil Prices, 2007–2022

U.S. Gasoline and WTI Crude Oil Prices, 2007–2022

Source: Bloomberg


Decreased Refinery Capacity

Demand for transportation fuels, such as gasoline, dropped sharply early in the pandemic when consumers stayed home, causing several refineries to close permanently. Global refinery capacity fell in 2021 for the first time in 30 years, according to the International Energy Agency (IEA). U.S. refinery capacity dropped to 2015 levels, as shown in Figure 2. Additionally, existing U.S. refineries have limited spare capacity with utilization rates above 93 percent, the highest since December 2019. Meanwhile, refiners are generating record profits from strong demand, capacity constraints, and a higher spread between prices for oil and refined products, such as gasoline.


Figure 2. U.S. Refinery Capacity, 2007–2022

Figure 2. U.S. Refinery Capacity, 2007–2022

Source: Bloomberg


Lower Inventory and Higher Demand

Both U.S. gasoline and oil inventories are at low seasonal levels compared to the five-year range, as shown in Figure 3, which highlights U.S. gasoline inventories. Gasoline and oil demand recovered faster than supply over the past two years while the economy bounces back from the pandemic. Refineries typically boost output before demand peaks during the summer; however, capacity constraints limit supply increases. Although the U.S. still imports oil because its refineries were initially designed to process heavy crude produced from other countries, such as Canada and Venezuela, higher U.S. exports have reduced inventories as Europe seeks to reduce its reliance on Russia for energy imports.


Figure 3. U.S. Gasoline Stocks, 2020–2022

U.S. Gasoline Stocks, 2020–2022

Decline in Oil Supply

Global oil producers quickly cut capital expenditures early in the pandemic to preserve cash for debt servicing and other operating expenses amid highly uncertain oil demand and plummeting prices that fell to around $20 per barrel. Figure 4 illustrates the decline in oil production from the OPEC and the U.S., the world’s two largest groups of producers. Supply from Russia, the world’s third largest oil producing country behind Saudi Arabia, also declined after its invasion of Ukraine.


Figure 4. OPEC and U.S. Oil Production, 2012–2022

Figure 4. OPEC and U.S. Oil Production, 2012–2022

Source: Bloomberg


Oil Production Constraints

Global oil production is slowly recovering as producers have been more cautiously investing in long-term projects, such as offshore drilling, due to a highly uncertain demand outlook for oil. Traditional automakers, for instance, are investing heavily in electric vehicles amid policy support and plans by several countries to phase out internal combustion engines (e.g., gasoline, diesel) in the coming decades.

Furthermore, shareholders have forced publicly traded oil and gas producers to focus on capital discipline, profitability, reducing debt, and investor returns through dividends and stock buybacks. Production growth was the prior objective from a capital allocation standpoint, but producers struggled to generate positive cash flow and earnings following the 2014–2016 crash in oil prices.

Several other market developments have contributed to a slow recovery in oil production:

  • S. oil producers focused on drilled but uncompleted wells (DUCs) to limit costs when oil demand began to recover after the pandemic. In other words, producers sacrificed future supply growth by completing existing wells at a faster rate than drilling new wells.
  • A large portion of U.S. oil supply is produced from shale regions, such as the Permian Basin. Compared to conventional wells, shale wells have high depletion rates that average around 70 percent by the end of the first year, according to asset manager, GMO. This requires continuous capital expenditures to maintain or increase production levels by drilling new wells.
  • Small private oil producers have been the main source of production growth in the U.S. as opposed to larger publicly traded producers given shareholder demands for capital discipline.
  • Inflationary pressures and shortages for labor and materials, such as steel, reduced the operating capacity for oil field service companies, which supply oil rigs and other equipment to producers.


U.S. Production Forecasts

The U.S. is the world’s top oil-producing country with supply averaging 11.9 million barrels per day over the past two months. Forecasts from the U.S. EIA imply moderately higher production of about 200,000 barrels per day for the remainder of 2022. Oil production growth is expected to accelerate in 2023 and reach an all-time high, averaging more than 12.8 million barrels per day.

A Look Ahead

For the immediate future (this summer), it looks like gas and oil prices will remain high due to global supply issues, low inventories, and increased travel. There is hope for an ease or decline of prices later in the year with the potential for more supply and lower demand. Please contact my office with any questions or requests for more information on current prices or future forecasts.


###

This material has been provided for general informational purposes only and does not constitute either tax or legal advice. Although we go to great lengths to ensure our information is accurate and useful, we recommend you consult a tax preparer, professional tax advisor, or lawyer.

Engage with the entire Blakely Financial team at WWW.BLAKELYFINANCIAL.COM to see what other financial tips we can provide for your financial well-being.


Robert Blakely is located at 1022 Hutton Ln #109 High Point, NC 27262 and can be reached at 336-885-2530

Securities and Advisory Services offered through Commonwealth Financial Network®,

Member FINRA/SIPC, a Registered Investment Adviser. Fixed insurance products

and services are separate from and not offered through Commonwealth Financial Network®.

Authored by Brad McMillan, CFA®, CAIA, MAI, managing principal, chief investment officer, at Commonwealth Financial Network®.

© 2022 Commonwealth Financial Network®

Food Inflation: What is Behind It and How to Cope

As measured by the Consumer Price Index for food at home, grocery prices increased 3.4% in 2020, a faster rate than the 20-year historical average of 2.4%.1 More recently, food inflation accelerated by 6.5% during the 12 months ending in December 2021, while prices for the category that includes meat, poultry, fish, and eggs spiked 12.5%.2

Food prices have long been prone to volatility, in part because the crops grown to feed people and livestock are vulnerable to pests and extreme weather. But in 2021, U.S. food prices were hit hard by many of the same global supply-chain woes that drove up broader inflation.

The pandemic spurred shifts in consumer demand, slowed factory production in the United States and overseas, and caused disruptions in domestic commerce and international trade that worsened as economic activity picked up steam. A shortage of metal containers and backups at busy ports and railways caused long shipping delays and drove up costs. Severe labor shortages, and the resulting wage hikes, have made it more difficult and costly to manufacture and transport many types of unfinished and finished goods.3

As long as businesses must pay more for the raw ingredients, packaging materials, labor, transportation, and fuel needed to produce, process, and distribute food products to grocery stores, some portion of these additional costs will be passed on to consumers. And any lasting strain on household budgets could prompt consumers to rethink their meal choices and shopping behavior.

Seven Ways to Master the Supermarket

The U.S. Department of Agriculture expects food inflation to moderate in 2022, but no one knows for certain how long prices might stay elevated.4 In the meantime, it may take more effort and some planning to control your family’s grocery bills.


Annual Change in Consumer Price Indexes for Food (through December 2021)

Source: U.S. Bureau of Labor Statistics, 2022


  • Set a budget for spending on groceries and do your best not to exceed it. In 2021, a typical family of four with a modest grocery budget spent about $1,150 per month on meals and snacks prepared at home. Your spending limit could be higher or lower depending on your household income, family size, where you live, and food preferences.5
  • To avoid wasting food, be aware that food date labels such as “sell by,” “use by,” and “best before” are not based on safety, but rather on the manufacturer’s guess of when the food will reach peak quality. With fresh foods like meat and dairy products, you can usually add five to seven days to the “sell by” date. The look and smell can help you determine whether food is still fresh, and freezing can extend the shelf life of many foods.
  • Grocery stores often rotate advertised specials for beef, chicken, and pork, so you may want to plan meals around sale-priced cuts and buy extra to freeze for later. With meat prices soaring, it may be a good time to experiment with “meatless” meals that substitute plant-based proteins such as beans, lentils, chickpeas, or tofu.
  • Stock up on affordable and nonperishable food such as rice, pasta, dried beans, canned goods, and frozen fruits and vegetables when they are on sale.
  • Select fresh produce in season and forgo more expensive pre-cut and pre-washed options.
  • Keep in mind that a store’s private-label brands may offer similar quality at a significant discount from national brands.
  • Consider joining store loyalty programs that offer weekly promotions and personalized deals.

1, 4–5) U.S. Department of Agriculture, 2021
2) U.S. Bureau of Labor Statistics, 2022
3) Bloomberg Businessweek, September 15, 2021

This material has been provided for general informational purposes only and does not constitute either tax or legal advice. Although we go to great lengths to ensure our information is accurate and useful, we recommend you consult a tax preparer, professional tax advisor, or lawyer.

Engage with the entire Blakely Financial team at WWW.BLAKELYFINANCIAL.COM to see what other financial tips we can provide towards your financial well-being.

Blakely Financial, Inc. is an independent financial planning and investment management firm that provides clarity, insight, and guidance to help our clients attain their financial goals.

Securities and advisory services offered through Commonwealth Financial Network, Member FINRA/SIPC, a Registered Investment Adviser.

Donna Teaching Crock-Pot Class at YWCA

Donna Blakely recently volunteered with the Junior League of High Point and helped teach a Crock-Pot cooking class at the YWCA to young moms. It was an educational workshop that included healthy eating focused on the nutritional needs of women and children. The JLHP provided each participant with a crock-pot, recipe book, and ingredients to help these moms recreate the meal at home that was demonstrated to them during the class. Anytime there is food and cooking involved, Donna loves to help out!

Donna Blakely Crock-Pot JLHP Junior League of High Point YWCA
Donna Blakely teaching Crock-Pot class with the JLHP Junior League of High Point YWCA

Women in Motion 2022 Summit

DONNA BLAKELY & SHAYLEN BROWN had the honor of attending the WOMEN IN MOTION 2022 Summit, which empowers women to elevate to the next level in their personal and professional lives. The day-long event focused on wellness and featured some fantastic speakers, including TANYA DALTON, author of The Joy of Missing Out and On Purpose. Dynamic women gathered together, elevating themselves and uplifting each other – what a wonderful day!

The 2022 summit focused on dimensions of wellness that will help women in leadership positions—and those who will soon be in leadership positions — navigate a variety of situations and expectations.

And just in case you are wondering, Donna & Shaylen did not plan the matching wardrobe!

Blakely Financial Russia-Ukraine Crisis Investors

What Does the Russia-Ukraine Crisis Mean for Investors?

Presented by Robert Blakely, Emily Promise, and Steve LaFrance

The next phase in the  Russia-Ukraine crisis has begun, as Russia has launched attacks on Ukraine. With a war underway, it’s unsurprising that the markets are reacting. Before the market opened on Thursday, U.S. stock futures were down between 2 1/2 percent and 3 1/2 percent, while gold was up by roughly the same amount. In addition, the yield on 10-Year U.S. Treasury securities has dropped sharply. International markets were down even more than the U.S. markets, as investors fled to the more comfortable haven of U.S. securities.

The Markets Are Being Hit Hard

News of the invasion is hitting the markets hard right now, but the real question is whether that hit will last. It probably will not. History shows the effects are likely to be limited over time. In retrospect, this event is not the only time we have seen military action in recent years. And it’s not the only time we’ve seen aggression from Russia. In none of these cases were the effects long-lasting.

Historical Context and Current Events

Let’s look back at the Russian invasion of Georgia and the Russian takeover of Crimea, which is part of Ukraine. In August 2008, Russia invaded the Republic of Georgia. The U.S. markets dropped by about 5 percent, then rebounded to end the month even. Then, in February and March 2014, Russia invaded and annexed Crimea. Again, the U.S. markets dropped about 6 percent on the invasion but rallied to end March higher. In both of these cases, the initial market drops were erased quickly.

Blakely Financial russia-ukraine geopolitical selloff

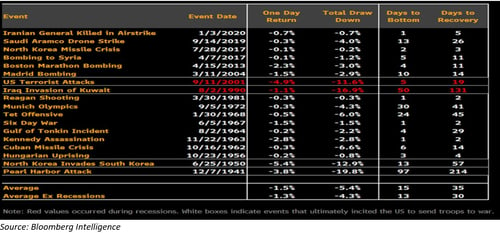
We essentially see the same pattern when looking at a broader range of events. For example, the chart below shows market reactions to other acts of war, both with and without U.S. involvement. Historically, the data shows a short-term pullback—as we will likely see today—followed by a bottom within the next couple of weeks. Exceptions include the 9/11 terrorist attacks, the Iraqi invasion of Kuwait, and, looking further back, the Korean War and Pearl Harbor attacks.

With Russia’s attack on Ukraine, the markets are reacting. But history shows the effects should be limited, according to Commonwealth CIO Brad McMillan.

Still, even with these exceptions, the market reaction was limited both on the day of the event and during the overall time to recovery. Moreover, comparing the data provides valuable context for recent events. For example, as tragic as the invasion of Ukraine is, its overall effect will likely be much closer to that of the Russian invasion of Ukraine in 2014, in which Russia annexed Crimea than it will be to the aftermath of 9/11.

Capital Market Returns During Wartime

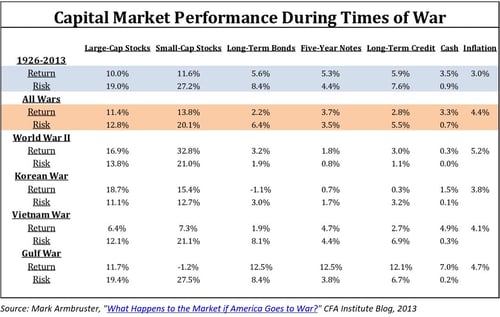
But even with the short-term effects discounted, should we fear that somehow the war or its impact will derail the economy and markets? Here, too, the historical evidence is encouraging, as demonstrated by the chart below. Returns during wartime have historically been better than all returns, not worse. Although the war in Afghanistan is not included in the chart, it too matches the pattern. During the first six months of that war, the Dow gained 13 percent, and the S&P 500 gained 5.6 percent.

With Russia’s attack on Ukraine, the markets are reacting. But history shows the effects should be limited, according to Commonwealth CIO Brad McMillan.

Sources: The indices used for each asset class are as follows: the S&P 500 Index for large-Cap stocks; CRSP Deciles 6-10 for small-cap stocks; long-term U.S. government bonds for long-term bonds; five-year U.S. Treasury notes for five-year notes; long-term U.S. corporate bonds for long-term credit; one-month Treasury bills for cash; and the Consumer Price Index for inflation. All index returns are total returns for that index.

Returns for a wartime period are calculated as the index’s returns four months before the war and during the entire war itself. Returns for “All Wars” are the annualized geometric return of the index over all “wartime periods.” Risk is the annualized standard deviation of the index over the given period. Past performance is not indicative of future results.

Expect a Headwind

This data is not presented to say that the Russia-Ukraine crisis won’t bring real effects and hardship. Oil prices are up to levels not seen since 2014, which was the last time Russia invaded Ukraine. Higher oil and energy prices will hurt economic growth and drive inflation worldwide, especially in Europe and the U.S. This environment will be a headwind as we advance.

Economic Momentum Going Forward

Will we see effects from the headwind caused by the Ukraine invasion? Very likely. Will they derail the economy? Not likely at all. During recent waves of Covid-19, the U.S. economy demonstrated substantial momentum, which should move us through the current headwind until markets normalize. Moreover, as has happened before, we already see U.S. production increase, which should help bring prices back down.

The Ukraine invasion has created current market turbulence; we should look at what history tells us. First, past conflicts have not derailed either the economy or the markets over time. Historically, the U.S. has survived and even thrived during wars.

What This Means for Portfolios

Although the current events with the Russia-Ukraine crisis have unique elements, they’re more of what we’ve seen in the past. Events like yesterday’s invasion do come along regularly. Part of successful investing—sometimes the most challenging—is not overreacting. If you’re comfortable with the risks you’re taking, you might not be making any changes—except perhaps to start looking for some stock bargains. Consider whether your portfolio allocations are at a comfortable risk level if you’re worried. If they’re not, talk to your advisor.


This material is intended for informational/educational purposes only. It should not be construed as investment advice, a solicitation, or a recommendation to buy or sell any security or investment product. Certain sections of this commentary contain forward-looking statements that are based on our reasonable expectations, estimates, projections, and assumptions. Forward-looking statements are not guarantees of future performance and involve certain risks and uncertainties, which are difficult to predict. All indices are unmanaged and are not available for direct investment by the public. Past performance is not indicative of future results. The S&P 500 is based on the average performance of the 500 industrial stocks monitored by Standard & Poor’s. The Dow Jones Industrial Average (‘the Dow’) is a price-weighted measurement stock market index of 30 prominent companies listed on stock exchanges in the United States.


Engage with the entire Blakely Financial team at WWW.BLAKELYFINANCIAL.COM to see what other expert advice we can provide towards your financial well-being.

Blakely Financial, Inc. is an independent financial planning and investment management firm that provides clarity, insight, and guidance to help our clients attain their financial goals.

Securities and advisory services offered through Commonwealth Financial Network, Member FINRA/SIPC, a Registered Investment Adviser.

Diversification and asset allocation programs do not assure a profit or protect against loss in declining markets, and cannot guarantee that any objective or goal will be achieved.

Authored by Brad McMillan, CFA®, CAIA, MAI, managing principal, chief investment officer, at Commonwealth Financial Network®.

© 2022 Commonwealth Financial Network®